Linewidth Measurement in Optical and Atomic-force Microscope for Metrological Control of Photomasks
Linewidth measurement is the most important metrological task of microelectronic technologies used for photomasks control purposes. Measurements of distances between two areas with specified intensity levels (in optical microscope), or between areas with specified level of signal from piezosensor level (in atomic-force microscope) lead to significant errors. Edge roughness and irregular shape of boundaries, caused by the aberrations in an optical microscope and by the size of the sensor in an atomic-force microscope (see Fig. 1) bring about additional problems in linewidth measurement.
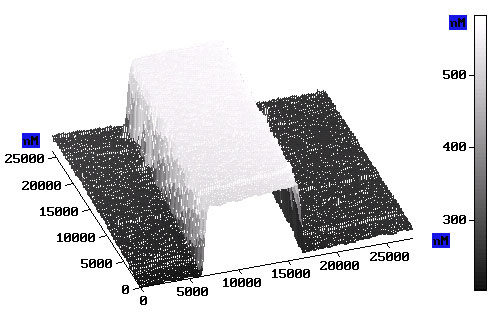
Fig.1.
Distribution of signal from sensor depthwise for photomask line (chromium on glass) 10 mcm wide in atomic-force microscope
To eliminate those difficulties it is proposed to use the first-zero position in the line image spectrum (sync function) for precise linewidth measurement.
A special research program to evaluate the accuracy of linewidth measurements by this technique in an optical microscope with a CCD camera was developed.
A library of images with linewidths renging from 0.5 to 10 mcm and different levels and sources of noise was synthesized.
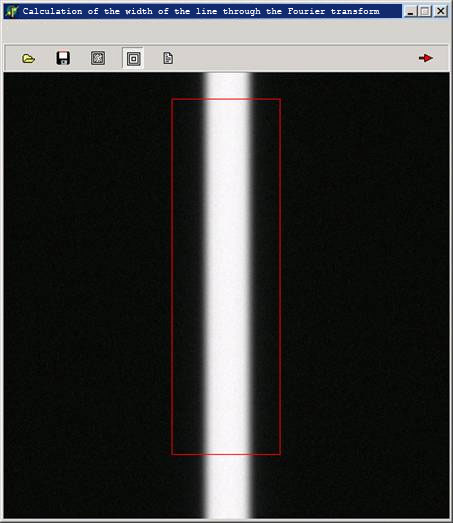
Fig. 2 shows work window of the program for image input and processing.
Fig. 2.
Work window for image input, background identification for calculating noise level and selection of line detail for which width is measured.
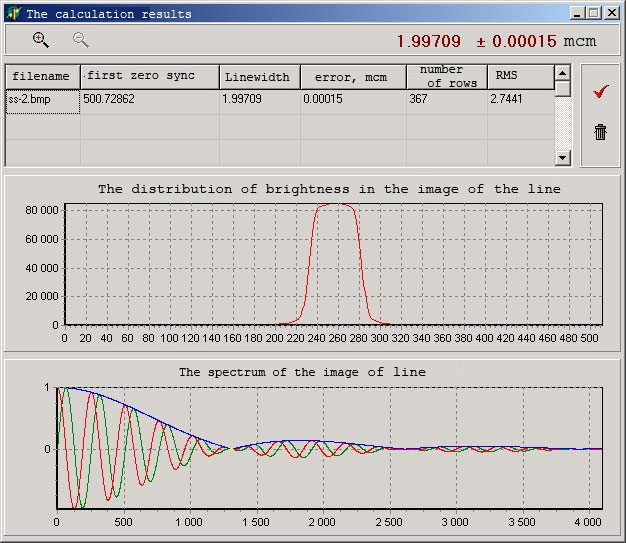
The linewidth calculation is conducted in the window shown in Fig. 3
Precise calculation of the first zero in the sync function is performed by interpolation of the readings and by means of the second order regression for the near-zero readings.
The measurement result is given in the upper part of the window. For the model line image 2 mcm wide the following result was received:
1.99709 ± 0.00015 mcm.
The measurement error for this model is 0.003 mcm.
The proposed program also captures the precise position of the first zero of the sync function (500.72862 mm-1), the number of rows used for averaging in accordance with the selected fragment (367 rows) and the noise RMS.
Fig. 3. Linewidth calculation window.
Top
|