Digital Two-Dimensional Autocollimator Calibration
The device calibration was conducted using precise engle measuring table (AMT) with the flat mirror mounted on its rotary module. The root-mean-square error of measurements with the mirror significantly exceeds the error when the BKR-180º prism is used. Therefore for calibration and measuring purposes the method of combined measurements with the evaluation of linear regression was used. This method allows to reduce the effect of random errors, caused by the mechanical instability of the test bench.
The comparative analysis of AMT and DAC concludes that their metrological parameters of engle coordinate measurements are sufficiently close. The resolution of both devices equals to 0.001''.
Two cycles of measurements were conducted for each axis (X, Y).
Table 4 shows the results of the first cycle of engle measurement during rotation of the mirror, mounted on the engle measuring table (AMT), for axis X. The readings measurement renge for axis Y was not more than 0.5''of engle.
Table 4
| # |
engle Measuring Table
(engular seconds) |
DAC Х
(engular seconds) |
Trend Estimate
(engular seconds) |
3-4
(engular seconds) |
| 1 |
2 |
3 |
4 |
5 |
| 1 |
49.42 |
515.454 |
515.569 |
-0.115 |
| 2 |
100.12 |
464.532 |
464.462 |
0.070 |
| 3 |
151.00 |
413.220 |
413.173 |
0.047 |
| 4 |
200.45 |
363.301 |
363.326 |
-0.025 |
| 5 |
251.64 |
311.647 |
311.725 |
-0.078 |
| 6 |
300.48 |
262.512 |
262.493 |
0.019 |
| 7 |
350.96 |
211.549 |
211.608 |
-0.059 |
| 8 |
414.31 |
147.830 |
147.749 |
0.081 |
| 9 |
451.82 |
109.988 |
109.938 |
0.050 |
| 10 |
500.53 |
60.845 |
60.837 |
0.008 |
| 11 |
551.86 |
9.208 |
9.094 |
0.114 |
| 12 |
601.20 |
-40.673 |
-40.642 |
-0.031 |
| 13 |
650.85 |
-90.696 |
-90.690 |
-0.006 |
| 14 |
700.30 |
-140.562 |
-140.538 |
-0.024 |
| 15 |
751.97 |
-192.651 |
-192.622 |
-0.029 |
| 16 |
801.79 |
-242.839 |
-242.843 |
0.004 |
| 17 |
855.49 |
-296.949 |
-296.974 |
0.025 |
| 18 |
901.36 |
-343.199 |
-343.212 |
0.013 |
| 19 |
952.11 |
-394.397 |
-394.370 |
-0.027 |
| 20 |
1000.37 |
-442.939 |
-443.017 |
0.078 |
| 21 |
1052.05 |
-495.222 |
-495.112 |
-0.110 |
| |
|
|
СКО |
0.061 |
Fig.1 shows the linear regression based on the combination of readings of AMT and DAC (columns 2, 3) for cycle X1. The coefficient for the linear regression term represents an estimated value.
Fig. 1.
Linear regression based on combination of readings of AMT and DAC for cycle X1
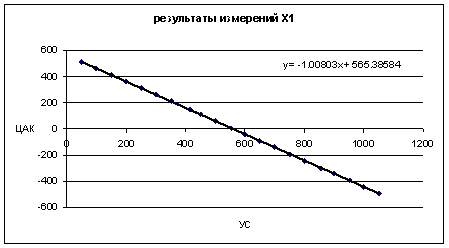
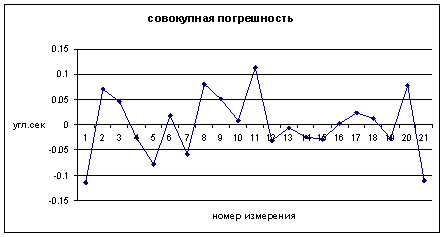
Column 4 in Table 4 shows the estimates based on the regression formula х = -1.00803x + 565.38584, and column 5 – the difference between the DAC real measurements and the formula estimates, where x are readings of AMT. Values in column 5 can be considered as a total error of calibration, determined by the metrological parameters of both devices. In the bottom of the table MSE of the total error, equal to 0.061'', is given. Fig. 2 shows the total error for X1 cycle.
Fig. 2 Total error for X1 cycle
For the second cycle of measurements (X2) we derived the following regression formula: y = -1.00797x + 565.42955, where x indicates the readings of the goniometrical table (AMT), and MSE of the total error equals 0.049''.
We assume the value of the calibration coefficient for axis X as the mean value of the two cycles - (1.00803+1.00799)/2 = 1.00801.
MSE of the total error 0.05'' and the renge of the total error of 0.1'' for two devices with a similar accuracy is a good indication of high quality of the measurements. For the calibration on axis Y the autocollimator tube was rotated 90 degrees, while the measurement renge for axis X did not exceed 0.5''.
Table 5 shows the results of the first cycle of the engle measurement for axis Y, with the AMT mirror rotated.
Table 5
| # |
engle Measuring Table
(engular seconds) |
DAC Х
(engular seconds) |
Trend Estimate
(engular seconds) |
3 – 4
(engular seconds) |
| 1 |
2 |
3 |
4 |
5 |
| 1 |
200.56 |
312.419 |
312.407 |
0.012 |
| 2 |
250.69 |
262.009 |
261.879 |
0.130 |
| 3 |
300.52 |
211.616 |
211.652 |
-0.036 |
| 4 |
352.11 |
159.669 |
159.652 |
0.017 |
| 5 |
407.67 |
103.597 |
103.651 |
-0.054 |
| 6 |
453.17 |
57.670 |
57.789 |
-0.119 |
| 7 |
501.29 |
9.221 |
9.286 |
-0.065 |
| 8 |
552.24 |
-42.092 |
-42.069 |
-0.023 |
| 9 |
600.71 |
-90.897 |
-90.924 |
0.027 |
| 10 |
652.26 |
-142.957 |
-142.884 |
-0.073 |
| 11 |
702.68 |
-193.504 |
-193.705 |
0.201 |
| 12 |
800.52 |
-292.360 |
-292.323 |
-0.037 |
| |
|
|
СКО |
0.089 |
Fig.3 shows the linear regression based on the combination of readings of AMT and DAC for cycle Y1.
Fig. 3.
Linear regression based on combination of readings of AMT and DAC for cycle Y1.
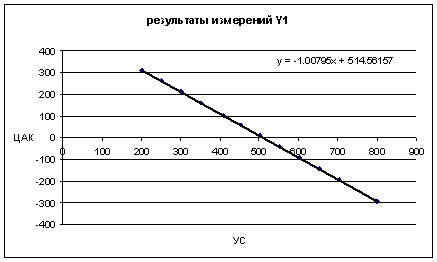
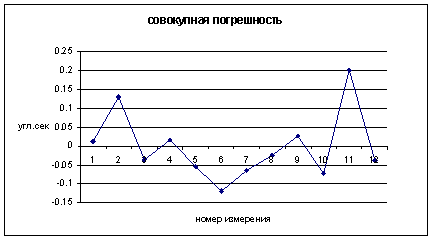
Column 4 of Table 5 shows the estimates based on the regression formula y = -1.00795x + 514.56157, and column 5 – the difference between the DAC real measurements and the formula estimates, where x are readings of AMT. Values in column 5 can be considered as a total error of calibration, determined by the metrological parameters of both devices. In the bottom of the table MSE of the total error, equal to 0.061'', is given. Fig. 4 shows the total error for Y1 cycle.
Fig. 4 Total error for Y1 cycle.
For the second cycle of measurements (Y2) we derived the following regression formula: y = -1.00813x + 514.71177, where x indicates the readings of the goniometrical table (AMT), and MSE of the total error was equal to 0.055''.
We assume the value of the calibration coefficient for axis Y as the mean value of the two cycles - (1.00795+1.00813)/2 = 1.00804.
Proximity of the calibration coefficients, RMS of the total error equal to 0.05'' and renge of the total error less than 0.1'' for both axes is also a good indication of the high measurement quality.
Follow-up Measurements
Follow-uo measurements were performed after the calibration coefficients were entered into the program. Since AMT is not certified for engle measurements, follow-up measurements were also conducted based on the regression analysis of the combined measurement results.
Table 6 shows the results of the follow-up engle measurements with the AMT mirror rotated toward axis X.
Fig.5 shows the linear regression curve based on combination of the readings of AMT and DAC (columns 2, 3) for axis X measurements.
Table 6
| # |
engle Measuring Table
(engular seconds) |
DAC Х
(engular seconds) |
Trend Estimate
(engular seconds) |
3 – 4
(engular seconds) |
| 1 |
2 |
3 |
4 |
5 |
| 1 |
50.76 |
505.622 |
505.695 |
-0.073 |
| 2 |
152.03 |
404.442 |
404.417 |
0.025 |
| 3 |
252.61 |
303.814 |
303.829 |
-0.015 |
| 4 |
353.65 |
202.767 |
202.781 |
-0.014 |
| 5 |
452.41 |
104.042 |
104.013 |
0.029 |
| 6 |
552.48 |
4.001 |
3.935 |
0.066 |
| 7 |
652.21 |
-95.771 |
-95.803 |
0.032 |
| 8 |
750.85 |
-194.377 |
-194.451 |
0.074 |
| 9 |
852.23 |
-295.891 |
-295.839 |
-0.052 |
| 10 |
951.99 |
-395.656 |
-395.607 |
-0.049 |
| 11 |
1052.00 |
-495.655 |
-495.625 |
-0.030 |
| |
|
|
СКО |
0.049 |
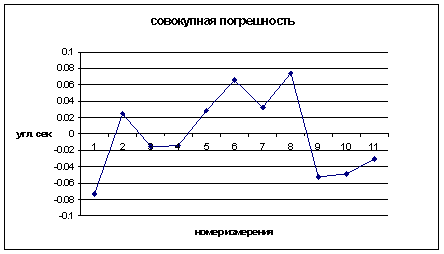
Column 4 of Table 6 shows the estimates based on the regression formula y = -1.00008x + 556.71177, and column 5 – the difference between the DAC real measurements and the formula estimates, where x are readings of AMT. Values in column 5 can be considered as a total error of calibration, determined by the metrological parameters of both devices. In the bottom of the table RMS of the total error, equal to 0.049", is given. Fig. 5 shows the total error for X axis measurements.
Fig. 5 Combined error for measurements in X direction plot
For combined Y axis measurements we derived the following regression formula: y = -0.9999x + 510.56146, where x are readings of goniometrical table and column 5 shows the difference between real measurements and the formula estimates, whereas and RMS of the total error was equal to 0.048''.
Conclusion.
The results of above research work and measurements enable us to draw the following conclusions:
1. In accordance with the linear regression formulas for follow-up measurements, the coefficients for the linear regression term differ from 1 within ± 0.0001. It means that the calibration error on the limit of the controlled renge ± 8' does not exceed 0.05'' and for the renge ± 1' – no more than 0.06''.
2. For both axes RMS of the total error does not exceed 0.05''.
3. For both axes the maximum spread of the total error does not exceed 0.08''.
4. As a result, the total error of digital autocollimators is within 0.1" (it should be noted that this is just the upper metrological limit of the device accuracy, referenced to the measurement tool, i.e. the engle measurement table)
Top
|
